April sees more jobs; quality wanting
By Christine J. S. Castañeda
Senior Researcher
THE RANKS of jobless Filipinos in April dipped from a year ago, but those working who wanted additional income increased in the same period, according to the latest government data released on Tuesday.
Results of the Labor Force Survey (LFS) conducted by the Philippine Statistics Authority put April’s unemployment rate at 5.5%, improving from the 5.7% recorded in the same month last year. This was equivalent to 2.36 million Filipinos, down from 2.44 million a year earlier.
April’s jobless reading was the lowest recorded for all April rounds in the past decade, according to the National Economic and Development Authority (NEDA).
This also puts the unemployment rate within the 4.7-5.3% target for 2018 under the Philippine Development Plan 2017-2022.
The employment rate, which is the proportion of the employed to the total labor force, slightly grew to 94.5% from 94.3%, as the net jobs created reached 625,000.
The size of the labor force was approximately 43.2 million out of an estimated 71.01 million Filipinos aged 15 years and older, for a participation rate of 60.9%. This was lower than last year’s 61.4%.
By industry, agriculture’s share in total employment slipped to 23.9% in April 2018 from 26.1% in April 2017, while those of services and industry rose to 56.4% and 19.7% from 55.4% and 18.5%, respectively.

Economists interviewed said that the results in sectoral employment were “not surprising.”
Ruben Carlo O. Asuncion, chief economist at Union Bank of the Philippines (UnionBank), noted that agriculture “has always been a laggard, so this is not surprising.”
“It must be noted that employment in agriculture and its measurement is very tricky because, unlike jobs in both services and industry, agriculture jobs are not all-year-round and some are part-time in nature,” he explained.
“But apart from the challenge of measurement, agriculture jobs are generally shrinking with the way the economy is developing with bias for services and industry.”
For Jefferson A. Arapoc, economist at the University of the Philippines (UP): “The employment rate increase in the service and industry sectors is not really surprising given the output growth that they recorded last quarter at seven percent and 7.9%, respectively.”
“The robust performance of these sectors positively affected their ability to generate gainful employment opportunities for the labor force. On the other hand, the agricultural sector posted the lowest output growth last quarter, standing at 1.5%,” he added.
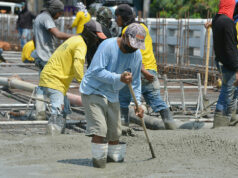
NEDA in a statement attributed growth in employment partly to the infrastructure build-up by both the private and public sectors. “Employment grew partly due to increased infrastructure spending as the Department of Public Works and Highways’ road projects and rehabilitation of public school facilities are already under way nationwide,” NEDA’s officer-in-charge, Undersecretary Jose Miguel R. de la Rosa said in the statement.
Mr. de la Rosa noted that industry’s “strong employment growth rate” of 8.1% was equivalent to 605,000 new workers, 468,000 of which came from construction.
The sector’s performance, he said, led to the increase in the sector’s employment share to 19.7% which is the “largest in the past decade.”
“We are now seeing the contribution of the ‘Build, Build, Build’ campaign in terms of job generation. We can expect the demand for workers in the sector to grow further as more projects break ground,” NEDA’s statement quoted Mr. de la Rosa as saying.
“However, youth unemployment remained high despite improving to 13.8%, which is also the lowest in the past decade.”
UNDEREMPLOYMENT WORSENS
Despite the slight drop in the jobless rate, underemployment — reflecting those already working, but are looking for more work or longer working hours — worsened to 17% or 6.93 million workers from 16.1%, equivalent to 6.47 million workers.
Among the underemployed, 47.1% were in services, up from 44.4%, LFS results showed. Industry made up 20.5% (up from 19.7%) and agriculture, 32.4% (down from 35.9%).
NEDA attributed the increase in underemployment rate to the “increase of those employed fulltime but wanting more work by 30.8%, or approximately 752,000 workers.”
“Still, other aspects of quality of employment significantly improved such as wage and salary employment, full time employment and mean hours of work,” it added.
Full-time workers — those who worked for at least 40 hours in a week — accounted for 68% of the employed, up from the 60.8% in the past year.
Part-time workers — those who worked for less than 40 hours in a week — made up 31%, down from 37.8%.
The same period saw working hours per week average 42 hours, up from 40.3 hours a year ago.
Wage and salary workers accounted for 63.8% of total employed persons, improving from 61.3% in the previous year. The self-employed without any paid employee were estimated at 27.2% (down from 28.2%), while unpaid family workers accounted for 5.3% (down from 6.7%).
For UnionBank’s Mr. Asuncion, the increase in underemployment for the period may have come from the “perennial problem of mismatch between the supply and demand of labor.”
For UP’s Mr. Arapoc, the high underemployment rate can be ascribed to the increase in the prices of consumer goods. “High inflation rate lowers a person’s purchasing power that could potentially make them look for more income generating activities,” Mr. Arapoc explained.
In a separate report released yesterday, the PSA said that inflation rose to 4.6% in May, the fastest in at least five years.
Looking forward, UnionBank’s Mr. Asuncion expects unemployment and underemployment to slip this year.
“I still see underemployment and unemployment to be better in the coming months, (i.e., underemployed and unemployed becoming less and less). If robust economic growth continues coupled with progressive government policies to harvest demographic dividends in the long run, I do not see any reason this will worsen,” he said.


